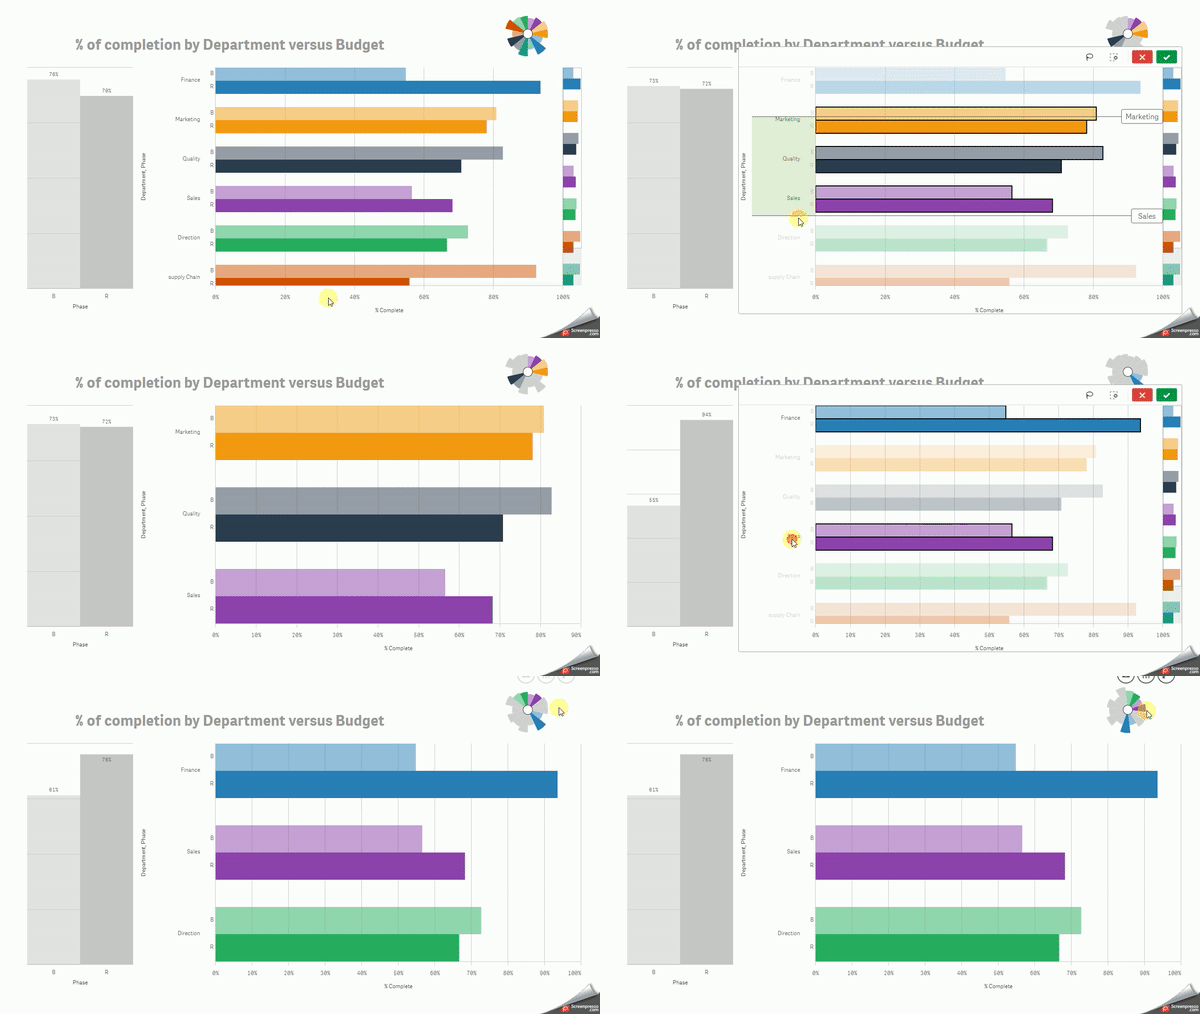
#19 👨🎨 Coloring by dimension and a gradient color in Qlik Sense
Yes, we are back with colours for the fifth time because I still find new features to add to our palette
In my example, you need to display Departments with their own colour, but Real vs Budget with a different gradient. Impossible ?
Let's go with coloring by Expression !🦸♂️
The trick is to attribuate a colour to each with Pick(Match()) and then to define transparency with a Frac(Rowno()) in argb() 🧙♂️
Did you noticed this cool Pie Chart ? 🐱👤
❓How To❓
Expression color is :
Pick(Match(Department,$(=Concat(all distinct chr(39)&Department&chr(39),','))),
argb(255*(1-frac(rowno(TOTAL)/2)),39, 174, 96),
argb(255*(1-frac(rowno(TOTAL)/2)),41, 128, 185),
Frac() gives you 0.5 or 0 because rowno() is divided by 2
The sort order of you second dimension define which of the two is transparent
Read more
#11 CUSTOM GRADIENT COLOR IN QLIK SENSE 🎨
#13 ADD INFORMATION BY COLORING WITH A SECOND MEASURE 🎨

